[Python]Moving Average & Disparity - 2. 시각화
2021. 8. 26. 23:30ㆍ카테고리 없음
yfinance를 이용하여 최근 1년 간 애플 주가 종가 데이터를 불러오자.
import yfinance as yf
# yfinance version: 0.1.63
import matplotlib.pyplot as plt

# aapl close price for recent 3 months
aapl = yf.Ticker('aapl')
close_aapl = aapl.history(period='1y', interval='1d').Close
1. 단순 이동평균 생성 및 시각화
# 1. Simple Moving Average; SMA
# 1-1.
sma5 = close_aapl.rolling(window=5, min_periods=None, win_type=None).mean()
sma20 = close_aapl.rolling(window=20, min_periods=None, win_type=None).mean()
sma30 = close_aapl.rolling(window=30, min_periods=None, win_type=None).mean()
sma60 = close_aapl.rolling(window=60, min_periods=None, win_type=None).mean()
# 1-2. Visualization
date = close_aapl.index
fig, ax1 = plt.subplots(constrained_layout=True, figsize=(16, 8))
ax1.plot(date, close_aapl.loc[date], label='Close', c='black', linestyle='--')
ax1.plot(date, sma5.loc[date], label='SMA5', c='red', linewidth=1.5)
ax1.plot(date, sma20.loc[date], label='SMA20', c='orange', linewidth=1.5)
ax1.plot(date, sma30.loc[date], label='SMA30', c='green', linewidth=1.5)
ax1.plot(date, sma60.loc[date], label='SMA60', c='blue', linewidth=1.5)
plt.title("AAPL Chart", fontsize=20)
ax1.set_xlabel("Date", fontsize=15)
ax1.set_ylabel("SMA", fontsize=15)
ax1.legend(loc='upper left', prop={'size': 15})
plt.show()
대체적으로 5일선이 20일과 30일 선을 돌파하면서 이평선이 정배열을 이루면 주가가 상승하는 경향을 잘 보여준다.
2. 가중이동평균 생성 및 시각화
가중이동평균 생성을 위해서는 다음과 같은 함수가 필요하다.
def weighted_mean(weight_array):
    def inner(x):
        return (weight_array * x).mean()
    return inner
weights_5 = np.arange(1,6)
weights_20 = np.arange(1,21)
weights_30 = np.arange(1,31)
weights_60 = np.arange(1,61)
# 2. Weighted Moving Average; WMA
# 2-1.
wma5 = close_aapl.rolling(5).apply(lambda prices: np.dot(prices, weights_5)/weights_5.sum(), raw=True)
wma20 = close_aapl.rolling(20).apply(lambda prices: np.dot(prices, weights_20)/weights_20.sum(), raw=True)
wma30 = close_aapl.rolling(30).apply(lambda prices: np.dot(prices, weights_30)/weights_30.sum(), raw=True)
wma60 = close_aapl.rolling(60).apply(lambda prices: np.dot(prices, weights_60)/weights_60.sum(), raw=True)# 2-2. Visualization
date = close_aapl.index
fig, ax1 = plt.subplots(constrained_layout=True, figsize=(16, 8))
ax1.plot(date, close_aapl.loc[date], label='Close', c='black', linestyle='--')
ax1.plot(date, wma5.loc[date], label='WMA5', c='red', linewidth=1.5)
ax1.plot(date, wma20.loc[date], label='WMA20', c='orange', linewidth=1.5)
ax1.plot(date, wma30.loc[date], label='WMA30', c='green', linewidth=1.5)
ax1.plot(date, wma60.loc[date], label='WMA60', c='blue', linewidth=1.5)
plt.title("AAPL Chart", fontsize=20)
ax1.set_xlabel("Date", fontsize=15)
ax1.set_ylabel("WMA", fontsize=15)
ax1.legend(loc='upper left', prop={'size': 15})
plt.show()
SMA와 형태가 살짝 다르다.
3. 이격도 그리기
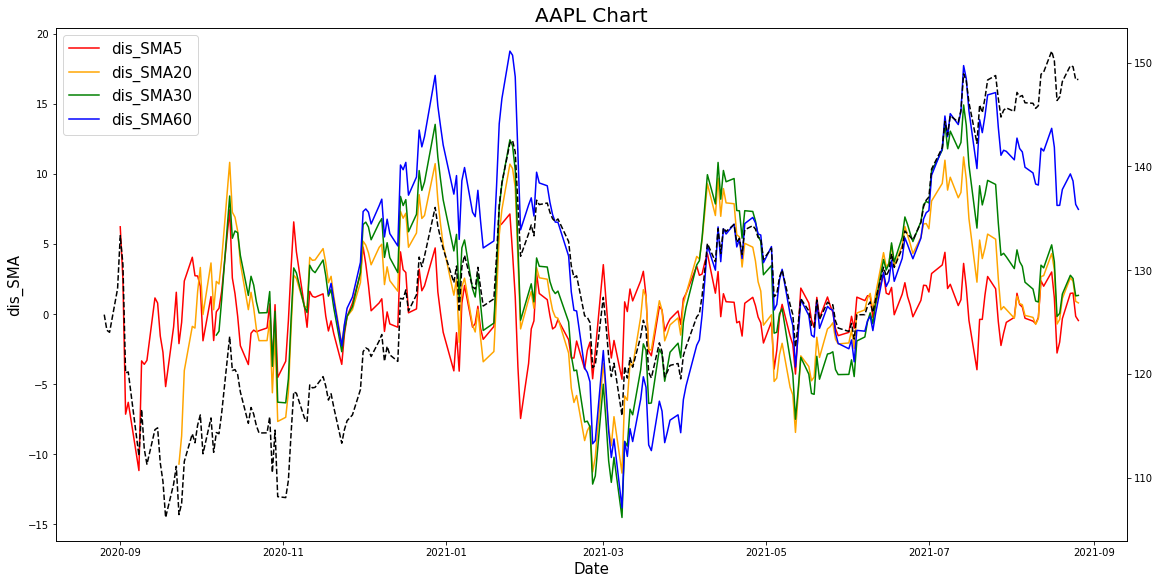
dis_sma5 = close_aapl - sma5
dis_sma20 = close_aapl - sma20
dis_sma30 = close_aapl - sma30
dis_sma60 = close_aapl - sma60
date = close_aapl.index
fig, ax1 = plt.subplots(constrained_layout=True, figsize=(20, 8))
ax1.plot(date, dis_sma5.loc[date], label='dis_SMA5', c='red', linewidth=1.5)
ax1.plot(date, dis_sma20.loc[date], label='dis_SMA20', c='orange', linewidth=1.5)
ax1.plot(date, dis_sma30.loc[date], label='dis_SMA30', c='green', linewidth=1.5)
ax1.plot(date, dis_sma60.loc[date], label='dis_SMA60', c='blue', linewidth=1.5)
plt.title("AAPL Chart", fontsize=20)
ax1.set_xlabel("Date", fontsize=15)
ax1.set_ylabel("dis_SMA", fontsize=15)
ax1.legend(loc='upper left', prop={'size': 15})
ax2 = ax1.twinx()
ax2.plot(date, close_aapl.loc[date], label='Close', c='black', linestyle='--')
plt.show()twinx() method를 이용하여 왼쪽 축은 이격도를, 오른쪽 축은 주가를 표시하자.
